

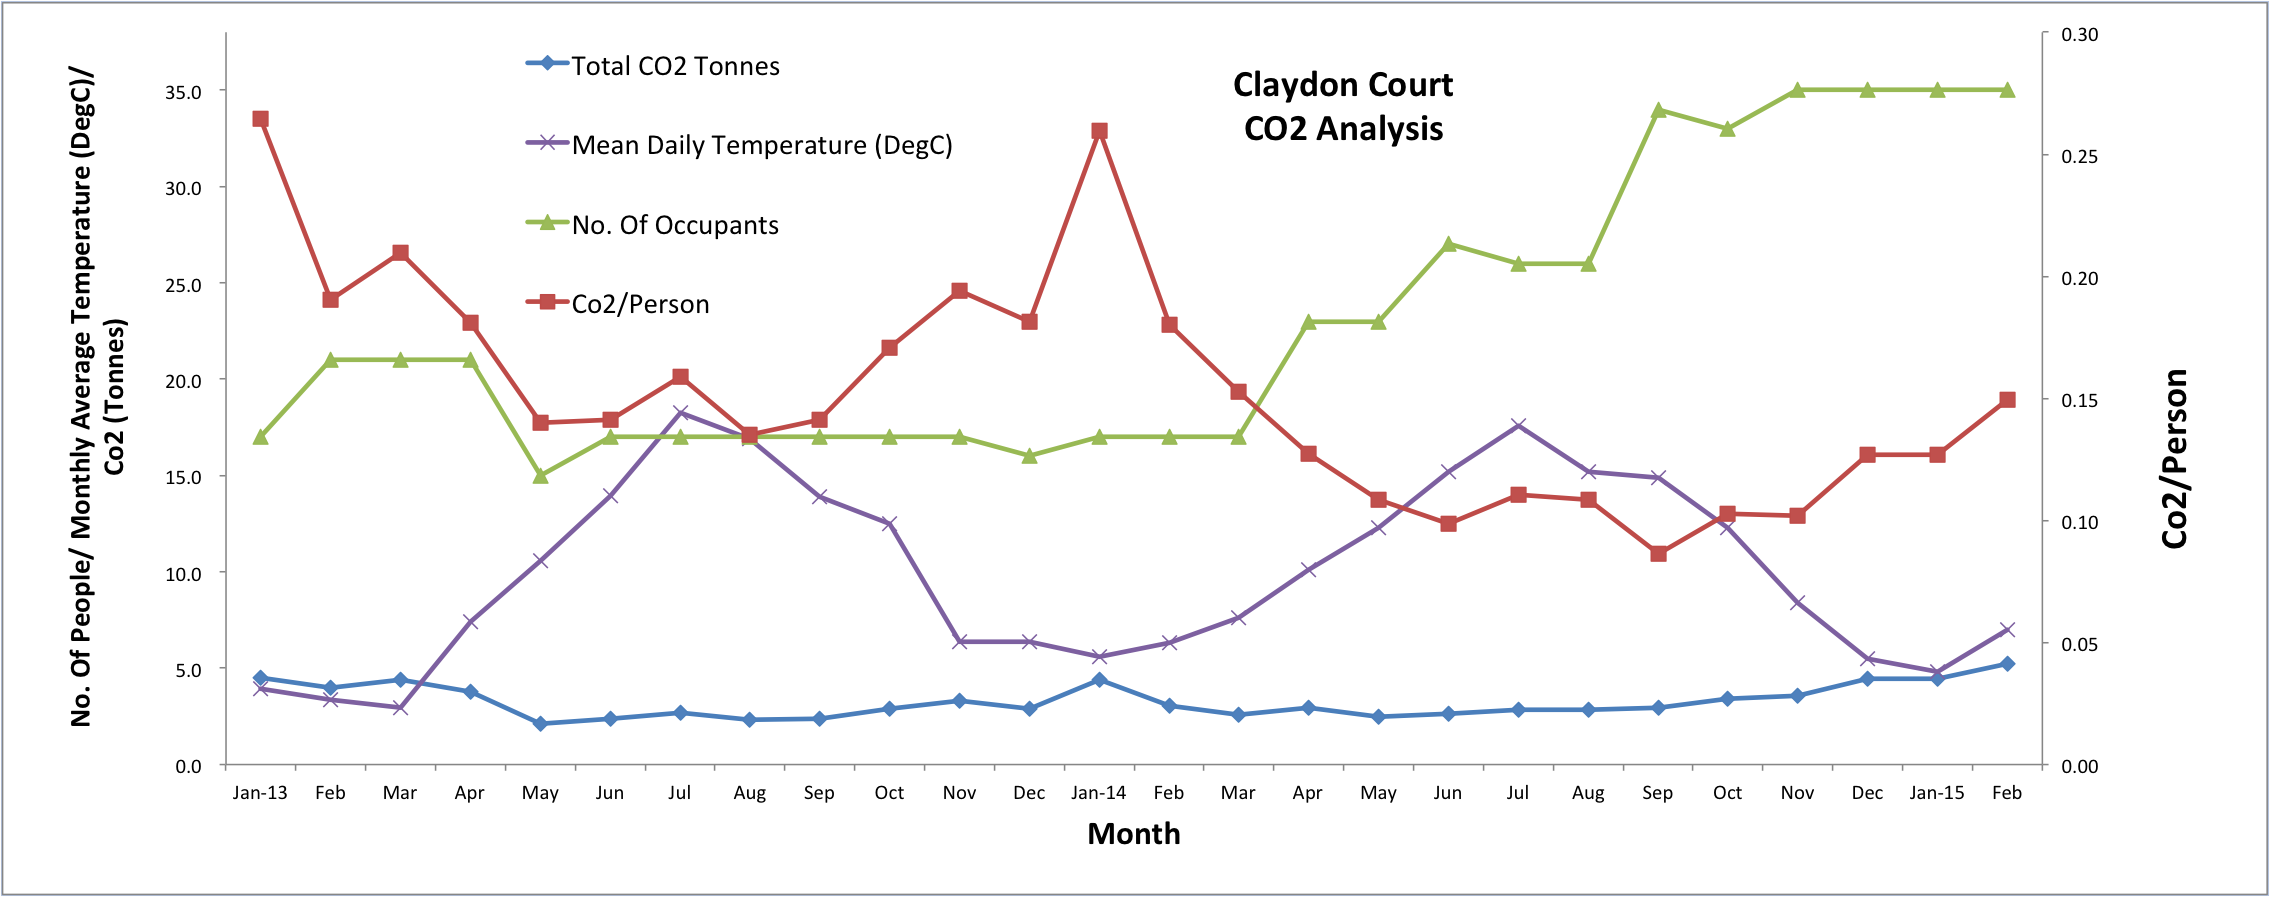
We constantly monitor the energy usage by tenants at Claydon Court and analyse the results so we identify ways to improve. Below is a graph of the Claydon Court emissions from January 2013 to present. Clearly there are some interesting trends we need to address.
 Click the graph to enlarge.
Some trends worth noting:
1. Our total Co2 emissions (blue line) have steadily risen as we’ve reached full occupancy
2. The amount of Co2/person (red line) has decreased despite the fact that more people have moved in which would indicate an overall reduction as we would expect it to remain constant.
3. We generally emit the most carbon/ person in January (red line).
4. We don’t emit that much less carbon in the summer months (blue line).
We would expect our total Co2 emissions to rise as more tenants move into our buildings however it seems so far that these tenants have been more efficient ones than those already here as the amount of carbon per person is lower than previous year so far particularly during the summer.
Neutral Territory is investigating implementing smart shading and ventilation measures to decrease the variable temperature in the building without mechanical intervention. We will be posting on this in the next few days.
Check out the notice board in the kitchen at Claydon Court to study this graph in paper form and please get in touch if you have any ideas on how we can reduce our energy demands!